


The Pollercoaster Finally Stops
It's time to put the pollsters' feet to the fire and test their accuracy once more.

Election Day is finally here — and as results continue to pour in over the coming days, the end draws near for the most stressful wonderful time of the year. At this point, both those incredibly invested in politics and those who barely pay attention are basically on the same page: it’s unclear which candidate will win.
No matter where you look — whether it be Silver Bulletin, FiveThirtyEight, or Split Ticket — the odds of either a Kamala Harris or Donald Trump victory are at the mercy of a mere coin flip. These organizations (among others) each took their own approach, employed their own strategies, and used whichever data they felt was best, and yet they all ended up at a similar conclusion. While there are theories for why this may be the case, such as herding among pollsters, it’s not as though there aren’t valid reasons for the election to be so contentious.
Political polarization, which is the shift between both parties from the center to their ideological extremes, is certainly heightened in today’s political climate. There is little common ground between Democrats and Republicans these days, and members of both parties feel increasingly negative about their colleagues across the aisle. It’s only natural that, given such a divided environment, elections would be so close.
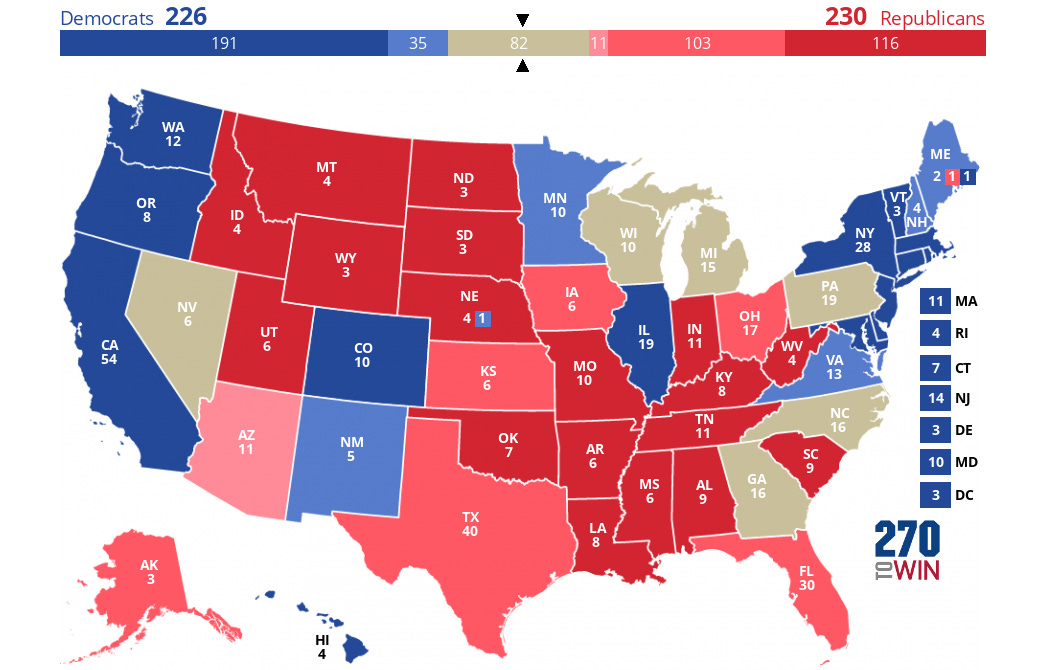
The same rule seems to also apply to cases in which pollsters produce outliers. In just the past couple of days, two pollsters that are lauded for their quality, Selzer & Co. and New York Times/Siena, released their final results for this election cycle, but had different results. While the Selzer poll had Harris ahead of Trump 47% to 44% in Iowa — a state that Trump beat Biden by in 2020 by over 8 points — the NYT/Siena poll reflected the opposite: that Blue Wall states like Pennsylvania and Michigan, which share similar voter demographics to Iowa, were in a dead heat (48% to 48% and 47% to 47%, respectively).
But even with the race being a toss-up, that doesn’t exactly mean that the outcome is guaranteed to be close. When factoring in the margin of error, both Kamala Harris and Donald Trump have a reasonable chance of winning with a comfortable lead. Take the New York Times polling averages for the seven battleground states, for example:
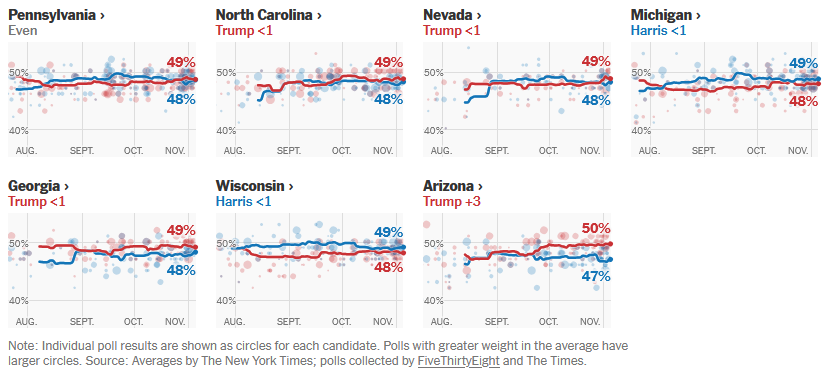
With even a standard margin of error, which typically ranges anywhere from 3 to 5 percentage points, either candidate could handily win any of those states. In Pennsylvania, arguably the most important state of the bunch, both Harris and Trump could win by as low as less than 1 percentage point, or as high as 5 percentage points. For a bit of perspective, that would be a bigger margin than what Trump beat Biden by in Florida back in 2020 (3.4 percentage points).
Given that polls seem to provide little insight as to a candidate’s advantage and can be incredibly volatile, can anything be learned from them?
Are Polls Just Bad?
Not necessarily. While it’s both true that there are misleading pollsters that claim to be non-partisan, but actually are (e.g., Rasmussen Reports), and that the polls underestimated Trump in both 2016 and 2020, it’s also true that they are the still the best tool that we have to gauge public sentiment. For all their flaws, pollsters take great care in their decision making, as even the slightest alterations can lead to dramatic changes in their results. When you’re measuring so many unknowns, such as the turnout of tens of millions of voters, with such little data (sample sizes of ~1,000 people), it’s remarkable that pollsters are even as accurate as they currently are.
While pollsters work endlessly to address their shortcomings, the public should also do its best to understand what polls and forecast models are actually trying to track: probabilities. In other words, we need to embrace the idea of uncertainty.
Even a candidate with a predicted 70% chance of winning still has a 30% chance of losing. If they end up losing, does that mean that the polls were off? Probably. Does that also mean that the probability of them losing wasn’t there? Absolutely not.
If this sounds similar at all, it’s because it actually happened in 2016 —FiveThirtyEight’s election model put Hillary Clinton and Donald Trump at basically those same odds (71.4% to 28.6%), and she ended up losing! Despite Nate Silver’s warning that Hillary’s lead wasn’t as safe as people had imagined, the outcome of the election still caused significant backlash against both him and FiveThirtyEight.
Instead of treating polls and models as if they are gospel, we should try to understand them for what they are: the momentary sentiments of the public. They are fleeting and can change at a moment’s notice, but they can provide incredible insight into the issues that voters care about and what they look for in candidates.
So, as you watch the results of this election with anticipation tonight and in the coming days, try not to blame the polls for being “wrong” about predicting a tie if one candidate ends up winning by a lot. Rather, try to understand that the outcome was already factored in: you just had to squint a bit to see it.